

OPEC Infighting
Reading the setup in OPEC and Crude.
In October of last year I created a video on our Youtube channel, “Oil and the Inverted Supply Curve...and how it causes the price of oil to CRASH!”
In the video I gave a quick historical overview of the Oil market and discussed a subtle but important nuance — that of the Inverted Supply Curve.
This simply means that the traditional Demand/Supply curve does not hold because national producers must (generally) produce more when prices drop, rather than less.
(This is especially true when they need revenues to balance their budgets, fund investments etc.)
Since then we have been keeping track of the Crude Oil chart on a monthly basis in Breakout by Philo — this was my commentary in the last issue.
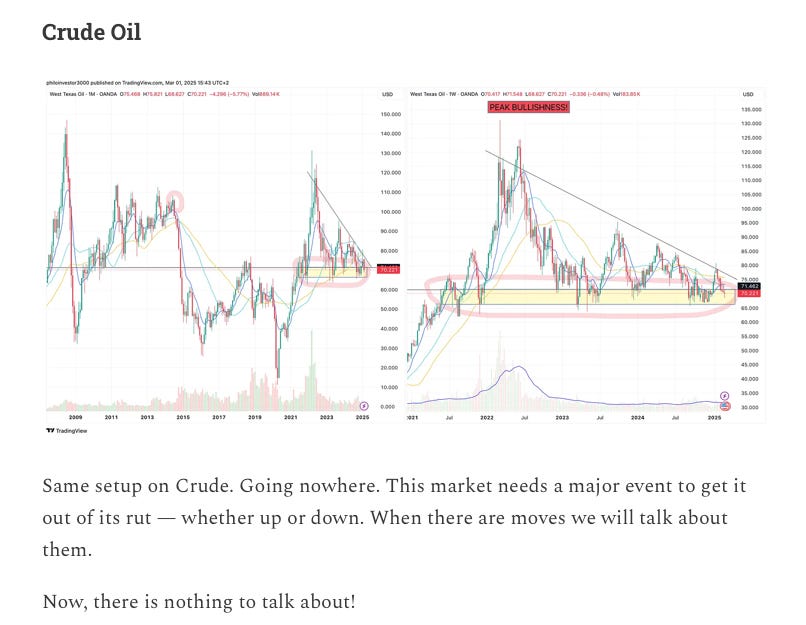
“This market needs a major event to get it out of its rut…”
It seems we are faced with the major event as of this week, and Crude has broken down below our yellow level of importance with a ~$10 move post-Liberation Day announcements.
Let’s look at the long-term chart for some technical context before we move to the setup in OPEC and how I am reading the move. Then we will talk about structuring trades to benefit from this policy move and oil price volatility.
Crude has been bouncing off the yellow range for 2 years now, after having crashed down from “PEAK BULLISHNESS” — remember all that? 😆
WTI went from $70 to $60 super fast and the XLE dropped 15% in two days with bearish energy clouds consolidating in the horizon…
With OPEC+ reversing their supply cuts (i.e. increasing production) and Trump’s Tariffs expected to blow up the global economy, energy is the first casualty.
The thing is, OPEC+ may be looking to execute a totally different plan.